Highlights of Economic Survey 2024-25
Union Finance Minister, Nirmala Sitharaman, presented the Economic Survey 2024-25 on 31 January 2025.
Economic Survey 2024-25 has following thirteen chapters.
| 1. State of the Economy: Getting Back into the Fast Lane | 2. Monetary and Financial Sector Developments: The Card and the Horse |
| 3. External Sector: Getting FDI Right | 4. Prices and Inflation: Understanding the Dynamics |
| 5. Medium-Term Outlook: Deregulation Drives Growth | 6. Investment and Infrastructure: Keeping it Going |
| 7. Industry: All about Business Reforms | 8. Services -New Challenges for the Old War Horse |
| 9. Agriculture and Food Management: Sector of the Future | 10. Climate & Environment: Adaptation Matters |
| 11. Social Sector -Extending reach and driving empowerment | 12. Employment and Skill Development: Existential priorities |
| 13. Labour in the AI Era: Crisis or Catalyst? |
|
Chapter-wise highlights of Economic Survey 2024-25 are given below.
Chapter 1. State of the Economy: Getting Back into the Fast Lane
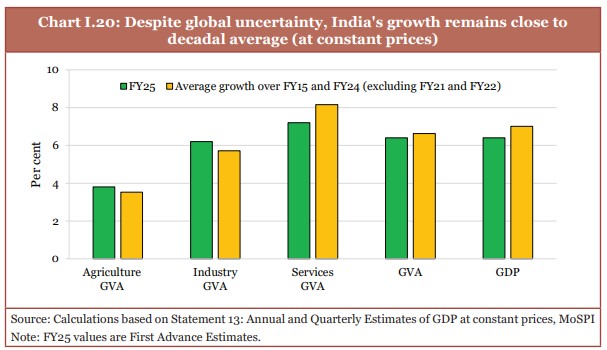
- India's real GDP and gross value added (GVA) both are estimated to grow by 6.4 per cent in FY25 (as per first advance estimates of national income).
- The real GDP growth in FY26 will be between 6.3 and 6.8 per cent.
(Source: Economic Survey 2024-25)
- Retail headline inflation has declined from 5.4 per cent in FY24 to 4.9 per cent in April –December 2024.
- Capital expenditure grew from FY21 to FY24.
- During July –November 2024, capital expenditure grew YOY by 8.2 per cent.
- India's share in global services exports is seventh-largest.
- Non-Petroleum and non-Gems & Jewellery exports increased by 9.1 per cent during April to December 2024.
- Global economic growth on an average was 3.3 per cent in 2023.
(Source: Economic Survey 2024-25)
Chapter 2. Monetary and Financial Sector Developments: The Card and the Horse
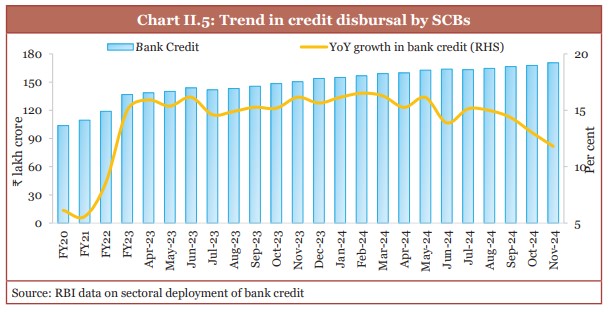
- Bank credit has grown at a steady rate.
- Credit growth improved faster than nominal GDP growth for two continuous years.
- The credit-GDP difference became less wide to (-) 0.3 per cent in Q1 of FY25 from (-) 10.3 per cent in Q1 of FY23.
(Source: Economic Survey 2024-25)
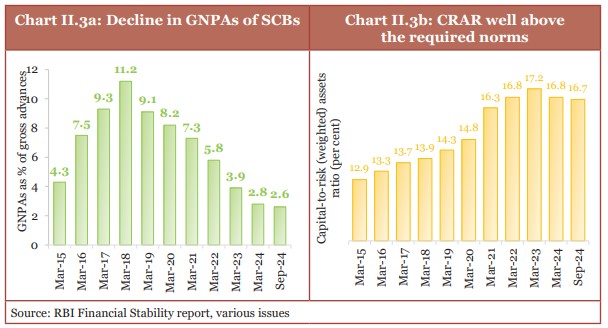
- Profitability of Scheduled Commercial Banks improved.
- There has been an increase in capital to risk weighted asset ratio (CRAR).
- The gross non-performing assets (GNPAs) of Scheduled Commercial Banks fell to a 12-year low level of 2.6 per cent of gross loans and advances at September 2024-end.
(Source: Economic Survey 2024-25)
- BSE stock market capitalisation to GDP ratio was 136 per cent at December 2024-end.
- This ratio was greater than China (65 per cent) and Brazil (37 per cent).
- In India, total insurance premiums grew by 7.7 per cent in FY24 and reached ₹11.2 lakh crore.
- In India's pension sector, total number of pension subscribers grew by 16 per cent (YoY) as of September 2024.
- RBI’s Financial Inclusion Index improved from 53.9 in March 2021 to 64.2 by March 2024.
- Number of demat accounts increased by 33% at December 2024-end on a YoY basis.
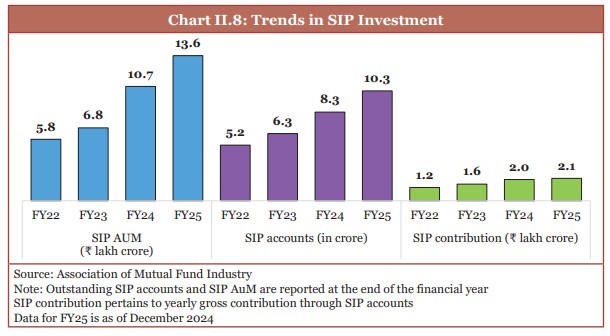
- Number of unique mutual fund investors doubled from FY21 to 5.6 crore as of December 2024.
- Monthly average gross SIP flows more than doubled in the last three years from FY22 to ₹0.23 lakh crore as of December 2024.
(Source: Economic Survey 2024-25)
Chapter 3. External Sector: Getting FDI Right
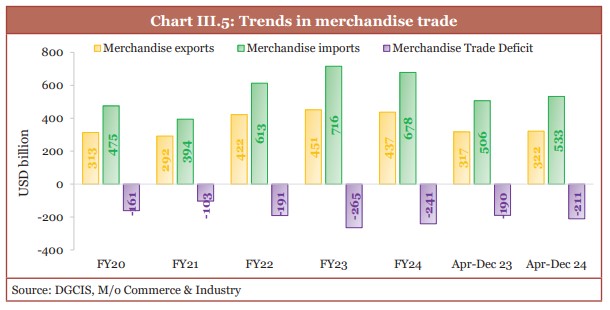
- In the first nine months of FY25, India's merchandise and services exports growth: 6 % (YOY)
- The merchandise trade deficit widened to USD 210.8 billion in April-December 2024.
- Faster rise in merchandise imports compared to exports contributed to this widening.
(Source: Economic Survey 2024-25)
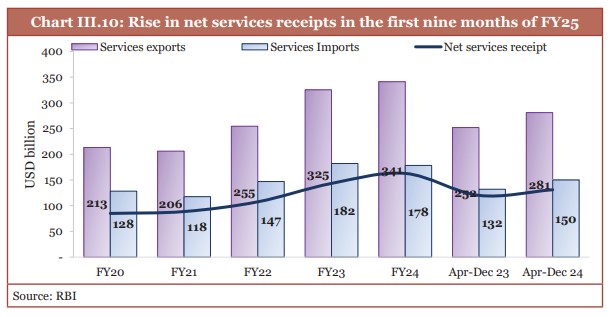
- During April–November FY25, India’s services export growth increased to: 12.8%
- India's share in global export market in ‘Telecommunications, Computer, & Information Services’: 10.2%
- Services sector exports grew at 11.6 per cent in the first nine months of FY25.
(Source: Economic Survey 2024-25)
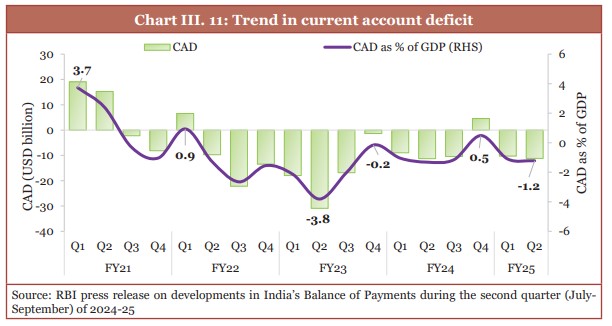
- India’s current account deficit (CAD) in Q2 of FY25: 1.2% of GDP
- The recent increase in the CAD can be said to be the result of a rise in the merchandise trade deficit.
- The increasing net services receipts and rise in private transfer receipts softened the effect of rise in the merchandise trade deficit.
(Source: Economic Survey 2024-25)
- Gross foreign direct investment (FDI) inflows signaled revival in the first eight months of FY25.
- Net FDI inflows declined relative to April-November 2023 because of an increase in repatriation/disinvestment.
- FDI inflows into India have reached over the USD 1 trillion level from April 2000 to September 2024.
- In first eight months of FY25, Gross Foreign Direct Investment (FDI) inflows in FY25 increased to: USD 55.6 billion (YoY growth of 17.9%)
- Services sector leads FDI inflows with 19.1% share in H1 FY25.
- Services sector is followed by technology, trading and non-conventional energy.
- Consultancy services (3.2%), Automobile industry (3.2%) and Hospital & diagnostic centers (3.1%) came at last.
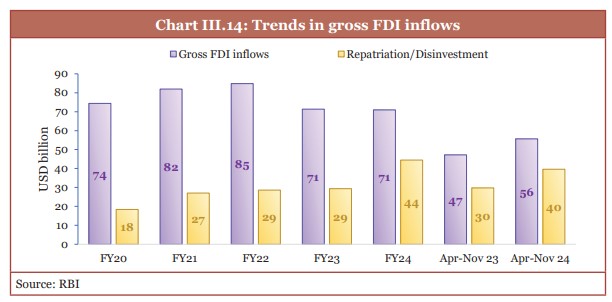
(Source: Economic Survey 2024-25)
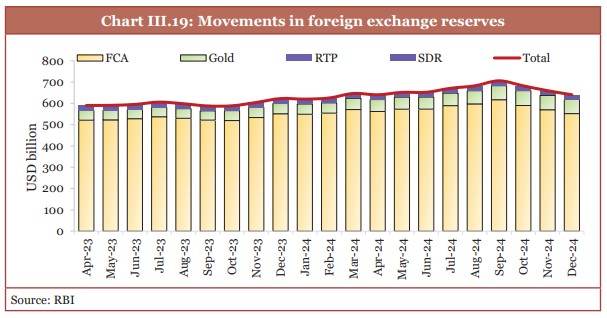
- As of the end of December 2024, India’s FOREX reserves were at USD 640.3 billion.
- These were enough to cover approximately 90 per cent of the country’s external debt.
- The external debt to GDP ratio stood at 19.4 per cent at September 2024-end.
(Source: Economic Survey 2024-25)
Chapter 4. Prices and Inflation: Understanding the Dynamics
- As reported by the IMF, the rate at which a fall in the value of money and a general increase in prices happens at global level became less extreme from peak of 8.7% in 2022 to 5.7% by 2024.
- India's retail inflation declined from 5.4 per cent in FY24 to 4.9 per cent in FY25 (April-December 2024), with the decrease believed to be the result of a decline in input prices.

(Source: Economic Survey 2024-25)
- RBI has forecasted that headline inflation will be 4.2 per cent in FY26.
- RBI and IMF have forecasted that India’s consumer price inflation will steadily and continuously change towards Government of India's official inflation target of around 4 per cent in FY26.
- Headline and food inflation driven by few food items such as vegetables and pulses.
- Vegetables and pulses contributed 32.3% to the overall inflation in FY25 (April to December).
(Source: Economic Survey 2024-25 Highlights)
Chapter 5. Medium-Term Outlook: Deregulation Drives Growth
- To be a Viksit Bharat by 2047, India needs a growth rate of around 8% at constant prices, on average, for about a decade or two.
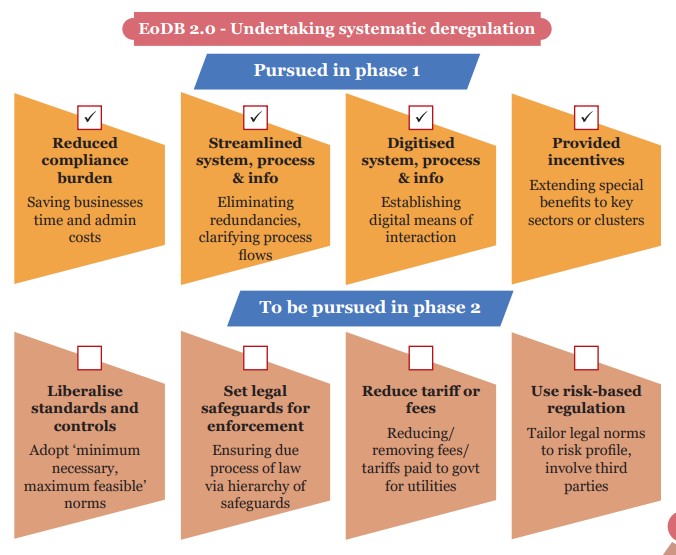
- India to focus on systematic deregulation. Economic survey 2024-25 calls for enhanced deregulation for micro, small and medium enterprises.
- Deregulation raises investment efficiency. And deregulation gives more economic freedom to individuals and enterprises.
- The survey adds that the Union Government has undertaken deregulation.
- The survey highlights that Ease of Doing Business (EoDB) 2.0 should be a state government-led initiative.
(Source: Economic Survey 2024-25 Highlights)
Chapter 6. Investment and Infrastructure: Keeping it Going
- Union government’s capital expenditure (capex) on major infrastructure sectors has shown 38.8 per cent growth rate from FY20 to FY24.
- Between April and October 2024, 17 new pairs of Vande Bharat trains were added to railway network.
- 5853 km of National Highways was added to road infrastructure in FY25 (April-Dec).
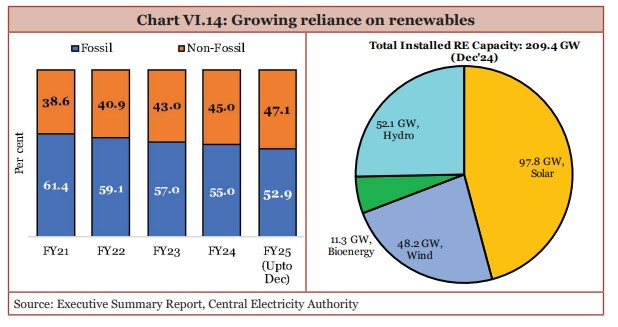
- Renewable energy capacity of solar and wind power increased by 15.8 per cent year-on-year by December 2024.
- Renewable energy’s share in India’s total installed capacity is now 47 per cent.
(Source: Economic Survey 2024-25)
- Under Phase II of the Swachh Bharat Mission-Grameen, 1.92 lakh villages were incrementally declared ODF Plus under the model category during April to November 2024.
- This increased the total number of ODF Plus villages to 3.64 lakh.
- Jal Jeevan Mission has provided piped drinking water to over 12 crore families since its launch in 2019.
(Source: Economic Survey 2024-25 Highlights)
Chapter 7. Industry: All about Business Reforms
- The industrial sector grew by 6.2 per cent in FY25.
- Although production of capital goods fluctuated between FY20 and FY23, it has shown a robust growth in FY24.

(Source: Economic Survey 2024-25)
- Government is promoting Smart Manufacturing and Industry 4.0, supporting Smart Advanced Manufacturing and Rapid Transformation Hub (SAMARTH) Udyog centres establishment.
- Indian automobile domestic sales grew by 12.5% in FY24.
- Pharmaceuticals turnover grew by 10.1% in the last five years.
- Domestic electronic goods production grew by 17.5% from FY15 to FY24.
- 99% of smartphones are manufactured domestically.
- India is presently world’s second largest cement producer after China. India is near self-reliance in cement production.
- Indian pharmaceutical industry is currently the world’s third-largest by volume.
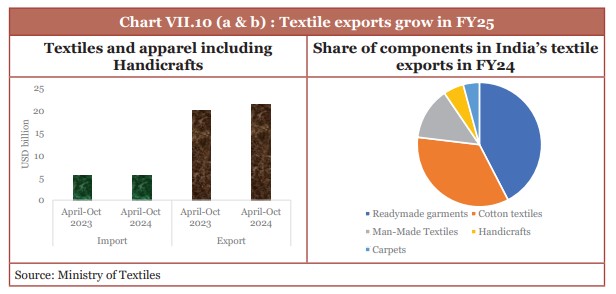
- The textile industry accounts for about 11 per cent of India’s manufacturing GVA.
- India ranks second globally in cotton, silk, and man-made fibre production.
(Source: Economic Survey 2024-25)
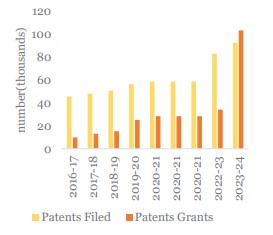
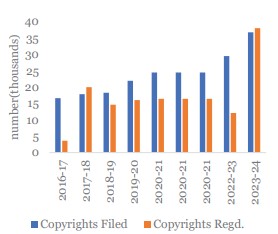
- India ranks sixth among top 10 patent filing offices globally.
- Patent filing increased by more than 2-fold since 2014-15.
- Domestic educational institutes’ patent filings have tripled from 2021-22 to FY24.
- Women applicants’ patent filings grew from 15 in FY15 to 5183 in FY24.
- There is a more than 17-fold increase in patent grants from 2014-15.
- India's Global Innovation Index ranking improved from 81st position in 2015 to 39th in 2024 among 133 economies.
(Source: Economic Survey 2024-25)
Chapter 8. Services -New Challenges for the Old War Horse
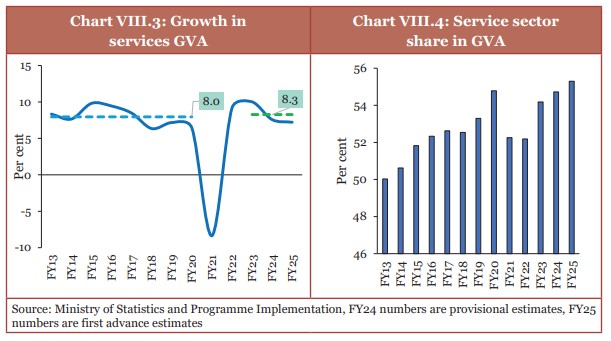
- The share of services in India’s GVA has increased from 50.6% in FY14 to 55.3% in FY25 (FY2024-25).
- It provides employment to nearly 30% of the workforce.
- Services sector’s average growth rate increased slightly from 8% in the pre-pandemic years (FY13 -FY20) to 8.3% in post-pandemic period (FY23–FY25).
- During decade (FY13–FY23), growth rate of information and computer-related services was 12.8% and their share in total GVA grew from 6.3% to 10.9%.
(Source: Economic Survey 2024-25)
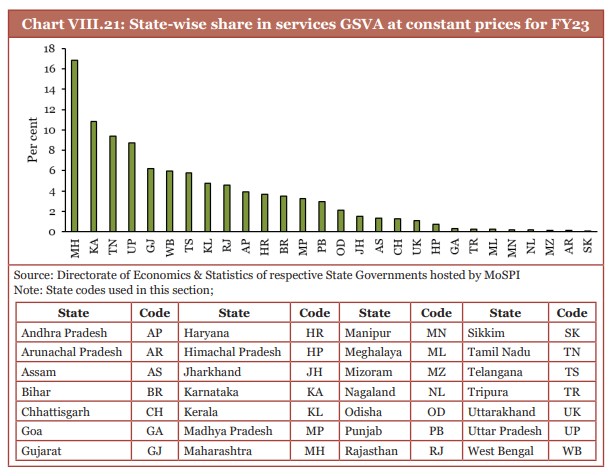
- For FY23, Karnataka and Maharashtra are more than one fourth part of the total service sector GSVA of all the states.
- For FY23, Karnataka and Maharashtra, Tamil Nadu, Uttar Pradesh, and Gujarat together share more than 50 per cent of the total service sector GSVA.
- Maharashtra (Mumbai), Tamil Nadu, Gujarat (GIFT City), and Karnataka account for over half of the financial services GSVA, indicating a strong concentration of financial services at these places.
(Source: Economic Survey 2024-25)
- India’s share in global services exports has increased from 1.9% in 2005 to 4.3% in 2023.
- From FY14 to FY23, services export grew at rate of 11% at constant prices.
- Approximately 70 percent of India's services exports are business and computer services.
- The credit growth to the services sector was 13% year over year.
- The service sector has been in the expansionary zone for 41 consecutive months since August 2021, as per HSBC's India services PMI.
- In FY23, tourism sector’s share in GDP again came at its pre-pandemic level of 5%.
- India is the fastest-growing aviation market globally.
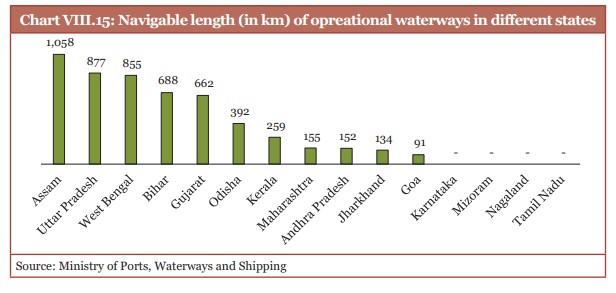
- The total navigable length of India’s waterways is nearly 14,850 km.
- As of October 2024, India has 26 operational waterways with over 4,800 km.
(Source: Economic Survey 2024-25)
Chapter 9. Agriculture and Food Management: Sector of the Future
- The ‘Agriculture and Allied Activities’ sector accounts for approximately 16% of India’s GDP for FY24 (PE) at current prices.
- The ‘Agriculture and Allied Activities’ sector supports about 46.1% of the population.
- In recent years, India’s agriculture sector growth averaged 5% annually from FY17 to FY23.
- Highest compound annual growth rate (CAGR) has been seen in fisheries sector (8.7%), followed by livestock (8% CAGR).
- The share of non-institutional credit has reduced from 90 per cent in 1950 to around 25.0 per cent in FY22.
- Share of institutional credit increased to 75% in FY22.

(Source: Economic Survey 2024-25)
Chapter 10. Climate & Environment: Adaptation Matters
- India’s installed electricity generation capacity accounts for 46.8 percent of the total capacity as of 30 November 2024.
- By 2030, Lifestyle for Environment (LiFE) measures are estimated to save consumers around USD 440 billion globally.
- Latest Forest Survey of India 2024 estimates India to have overall carbon sink of 30.43 billion tonnes of CO2 equivalent in 2023, as compared to 2005.
- In 2005, carbon sink was estimated to be 28.14 billion tonnes of CO2 equivalent.
- India’s NDC target is to raise carbon sinks by 2.5 to 3 billion tonnes of CO2 equivalent by 2030.
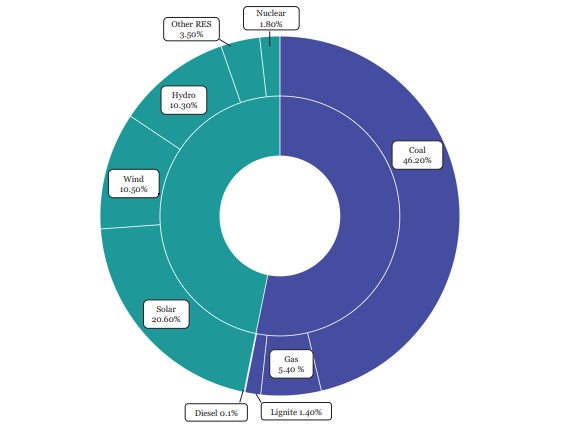
India’s Installed Generation Capacity (fuel-wise) (30-11-2024) (Source: Economic Survey 2024-25)
Chapter 11. Social Sector -Extending reach and driving empowerment
- The social services expenditure by central and state governments grew at a compound annual growth rate (CAGR) of 15% from FY21 to FY 25.
- Expenditure on education increased at a CAGR of 12 per cent from FY21 to FY25.
- Expenditure on health increased at CAGR 18 per cent from FY21 to FY25.
- Gini coefficient is a measure of inequality in consumption expenditure.
- For rural areas, Gini coefficient fell from 0.266 in 2022-23 to 0.237 in 2023-24.
- For urban areas, Gini coefficient declined from 0.314 in 2022-23 to 0.284 in 2023-24.
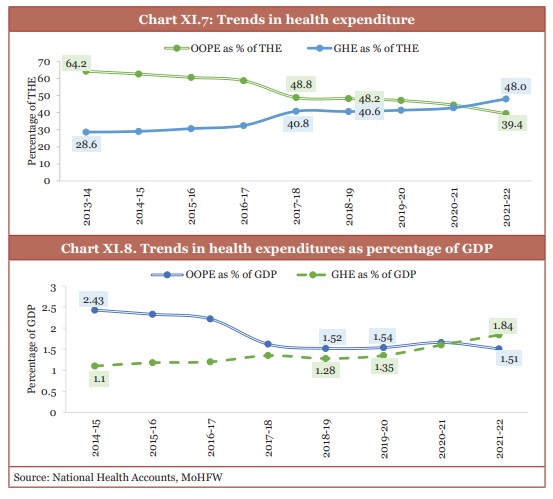
- Share of government health expenditure (GHE) in total health expenditure increased from 29.0 per cent to 48.0 per cent between FY15 and FY22.
- Share of out-of-pocket expenditure (OOPE) in total health expenditure fell from 62.6 per cent to 39.4 per cent between FY15 and FY22.
(Source: Economic Survey 2024-25)
Chapter 12. Employment and Skill Development: Existential priorities
- Unemployment rate has fallen from 6.0 per cent in 2017-18 (July-June) to 3.2 per cent in 2023-24 (July-June).
- Economic Survey says as per NITI Aayog, the gig workforce is projected to reach 23.5 crore by 2029-30.
- Sectors offering vast potential for creating high-quality jobs are the digital economy and renewable energy.
- It is projected that India’s digital economy will surpass USD one trillion by 2025.
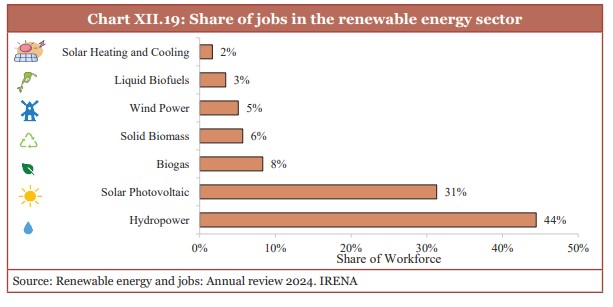
- The largest employer in India’s renewable sector is hydropower.
- It accounts for 20% of the global total and ranks second only to China.
(Source: Economic Survey 2024-25)
Chapter 13. Labour in the AI Era: Crisis or Catalyst?
- Developers of Artificial Intelligence (AI) promise to usher in a new age.
- The future revolves around 'Augmented Intelligence'.
- In Augmented Intelligence, both human and machine capabilities are integrated.
- Global corporate investments in all types of AI stood at USD 761 billion between 2021 and 2023.
- Annual global private investments in Generative AI increased from approximately USD 3 billion in 2022 to USD 25.2 billion by the end of 2023.
- As per estimates of International Labour Organisation, about 75 million jobs globally are at complete risk of automation due to AI.
- As estimated by NASSCOM, Indian AI market growth will be in the range of 25 to 35 per cent CAGR by 2027.
Frequently Asked Questions (FAQs) about Economic Survey 2024-25
What were the growth projections for 2025-26 as per Economic Survey 2025?
What is Economic Survey?
Who prepares the Economic Survey in India?
Happy February get 35% Off
Use Coupon code FEB26


Share Blog
 Latest
Daily Current Affairs

New Launch
MONTHLYCURRENT AFFAIRS
FEBRUARY 2026
SAGA
Latest Current Affairs

Daily Current Affairs and GK | 12 and 13 April 2026
Read More
Daily Current Affairs and GK | 11 April 2026
Read More
Daily Current Affairs and GK | 10 April 2026
Read More
Daily Current Affairs and GK | 9 April 2026
Read More
Daily Current Affairs and GK | 8 April 2026
Read More

Comments