Data Interpretation | Types of Questions and How to solve Data Interpretation
Questions from the Data Interpretation topic are asked in almost every competitive exam. Generally, questions from this topic are asked in a group of 3 – 5 questions based on tables, pie charts and graphs. So, it becomes a very important topic for any exam. Let us understand the basics of this topic and learn what points should be taken care of while solving questions from this topic.
What is Data?
Data is the collection of numbers, facts, and figures which have some meaningful interpretation when arranged in a proper way,
For example, The representation of data regarding people below the poverty line helps in providing help to such people.
What is Data Interpretation?
When analysis or interpretation of data is being made to draw some inference and conclusions, it is known as data interpretation.
Generally, the question asked from data interpretation are based on the topics ‘Percentage’, ‘Average’, ‘Addition/subtraction’ and ‘Ratio and Proportion’. So, command over calculations and these topics is necessary to score well in this section.
The different methods of arranging data are:
- Tabular Method
- Graphical Method
- CaseLet Form
Tabular Method Data Interpretation
In the tabular method, data is arranged in vertical and horizontal rows. It is the easiest way of representing data but not the easiest way of interpreting data. Generally, questions based on tabular method comprises of data regarding Production/Profit/sales of different companies in a year, List of students in a class, list of defective items, Income of different persons, etc.
In the tabular method, either rows or columns are used to represent the discrete non-connected data while other represents connected continuous variable.
For example: In the Representation of Production/Profit/sales of different companies in a year, the production of one company in different years represents connected continuous variables while the production of different companies represents the non-connected discrete variables.
Strategy to solve tabular method DI
Generally, the question asked from Table Data Interpretation (DI) comprise of two kinds of tables: (1) Complete data tables (2) Missing data tables
While solving the missing data table, try to complete the data in the Table if it can be initially completed, as it will help you in solving questions.
- To solve the question, first, note down all the variables against which you have to extract the data from Table. E.g., In a table chart comprising of incomes data of 5 persons in 5 years and for solving questions you need data of persons B and C in two years, then just write down all the needed data first and then start solving the question.
- Questions from tablular data are basically asked in three forms:
- Addition/Difference based: For table chart comprising of incomes data of 5 persons in 5 years question like find the difference between incomes of two persons in two different years can be asked. These questions are very easy so try to find such question and in case of lack of time go for these questions first.
- Average based: For table chart comprising of incomes data of 5 persons in 5 years question like find the average Income of a person in 5 years can be asked. This type of questions are also easy and require addition skills so can be solved easily.
- Ratio based: Again, the questions from ratio are very easy. You need only addition skills with the knowledge of writing equivalent ratios.
- Percentage based: These questions require a bit of calculation sometimes so should be dealt at the end of the paper in case if lengthy calculations are given.
\({Percentage \space change=\dfrac{Difference}{Original \space value}*100}\)
Tabular DI Example Question
Directions: Read the following information carefully and answer the questions accordingly
The following Table represents the population of six different cities (in thousands) and the percentage of males, females, and children among them. It is also given that there is no other person(s) who lie outside the category of males, females, and children. Also, children are exclusive of male and female.
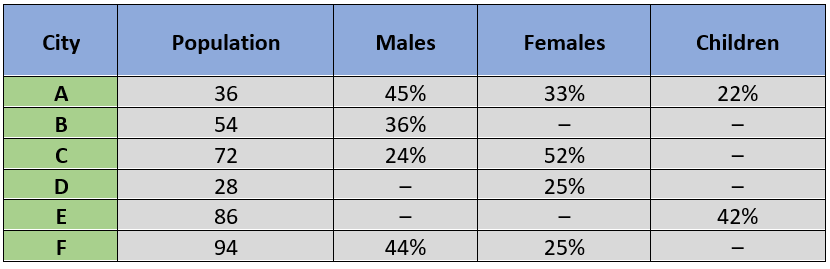
Q. What is the average number of children in city A, C, E and F?
Solution: Number of children in city A = 22% of 36000 = 7920
Number of children in city E = 42% of 86000 = 36120
Percentage of children in city C = (100 – 24 – 52) = 24%
Number of children in city C = 24% of 72000 = 17280
Percentage of children in city F = (100 – 44 – 25) = 31%
Number of children in city F = 31% of 94000 = 29140
\({Average \: number \: of \: children=\dfrac{Total \: number \: of \: children \:in \: city \:A, \: C, \: E, \: F}{4}*100}\)
\({⇒\dfrac{7920+36120+17280+29140}{4}=\dfrac{90460}{4}=22615} \:children\)
Note: To solve this type of question, one can use approximation and eliminate other options.
Graphical method Data Interpretation
There are different methods to represent data graphically. Some of them are:
1. Bar Graph
This is the easiest method for both representation and interpretation of data, so it is a widely used method for representation of data. In this method, data is represented through horizontal/vertical rectangles known as a bar. The data representation is through the length of the bars, while the width of the bars does not have any meaning.
Data is represented in a scaled form. Scaling of data means the actual value or amount is shrunk or expanded to a scaled amount so that data fits in the bars easily.
Bar Graph DI Example:
Directions: Study the following bar chart carefully and answer the questions given beside.
The bar graph given below represents the number of boys and the number of girls studying in five different colleges.
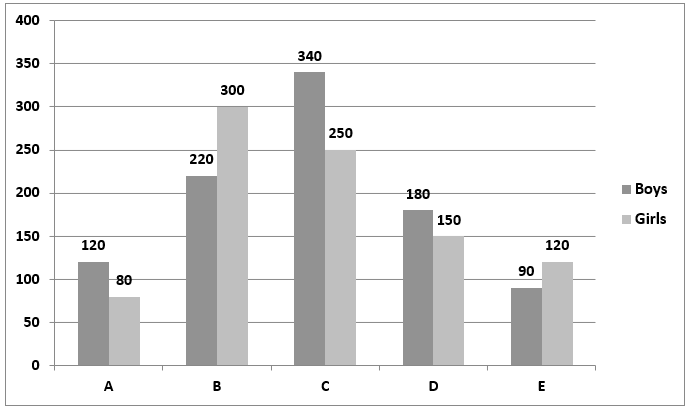
Q. What is the ratio between the sum of the number of boys studying in colleges A, B and C together to the sum of the number of girls studying in the college B, C and D together?
Solution: The number of boys studying in the college A, B, and C together = 120 + 220 + 340 = 680
The number of girls studying in the college B, C, and D together = 300 + 250 + 150 = 700
The required ratio = 680 : 700 = 34 : 35
2. Line Chart
In this chart, data is represented between Horizontal and vertical axis. Data is represented through a point between the axes, and then points are connected through lines to give it the form of a line chart.
If a line increment upwards between two points, then quantity on point 2 is said to be more than quantity on point 1, and if line decrement downwards between two points, then quantity is said to be decreasing.
The non-connected discrete variables are represented through different line graphs between the same horizontal and vertical axis. For example: If we are representing the production of 3 companies in 5 years, then it will be represented by 3 line graphs.
Line Charts are generally used to show the growth of a company or a product.
Line Chart DI Example:
Directions: The line chart given below shows five dealers A, B, C, D, and E selling three different types of cars (In thousands) viz. Swift, Audi, and WagonR. Read the following line chart and solve the given question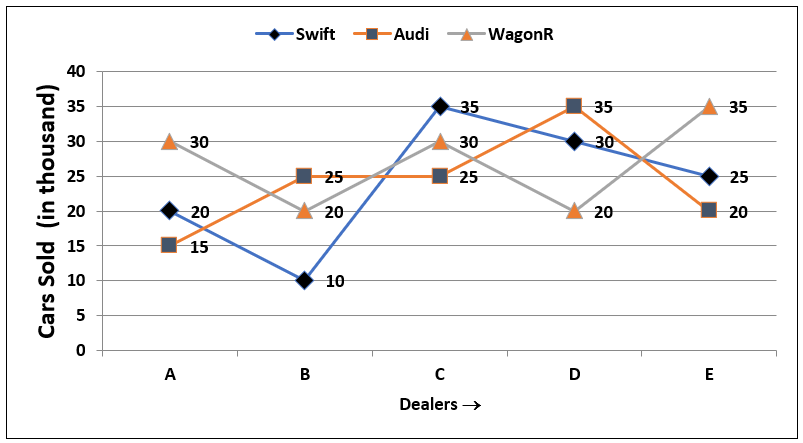
Q. Number of cars sold by A and B is how much percentage more than the cars sold by C?
Solution: Cars sold by \(A \& B = (65 + 55)\) thousand = 1,20,000
Cars sold by C = 90,000
\({{Required \space percentage}=\dfrac{Cars \: sold \: by \: A \: \& \: B \: - Cars \: sold \: by \: C }{Cars \:sold \:by \:C} *100}\)
\({=\dfrac{1,20,000-90,000}{90,000}×100=\dfrac{30,000}{90,000}×100}\)
= 33.33%
3. Pie Chart
Pie-charts are used to represent the data in a circular manner. It is used generally to represent the continuous variables of different persons/products/company/place etc. in the form of sectors in a circle.
The whole data in the pie chart is represented in a break-up form or sector or parts. Each part or break up of data comprises of the area in the circle in proportion to the share of it with respect to whole data.
As the whole data is represented in the form of a circle so, in terms of angles, whole data is represented by 3600. Thus, we can say that area of each sector will be proportional to the central angle.
\({The \: central \: angle \: of \: each \: sector \: or \: part=\dfrac{Value \: of \: sector \: or \: part}{Total \: value }*{360 ^0}}\)
Pie Chart DI Example:
Directions: The following pie charts show the distribution of students of graduate and postgraduate levels in seven different institutes in a town.
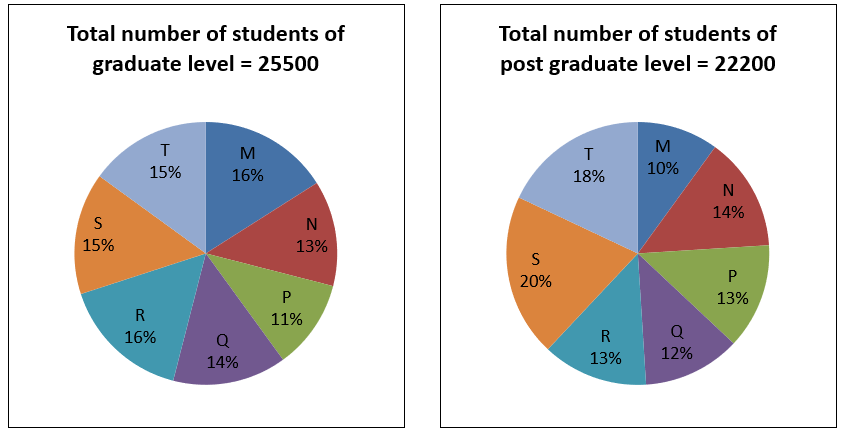
Q. What is the difference between the central angles of non-graduate and graduate students in institute T?
Solution: Value of graduate students in institute T = 15%
Total value of graduate students = 100%
Value of non-graduate students in institute T = 18%
Total value of non-graduate students = 100%
Central angles of non-graduate students in institute T will be
\({⇒\dfrac{Value \: of \: non\: graduate \: students\: in \: institute\: T}{Total \: value }*360^0=\dfrac{18}{100}*360}\)
Central angles of graduate students in institute T will be
\({⇒\dfrac{Value \: of \: graduate \: students\: in \: institute\: T}{Total \: value }*360^0=\dfrac{15}{100}*360}\)
Thus, the required difference = central angles of non-graduate students in institute T - Central angles of graduate students in institute T will be
\({⇒\dfrac{18}{100}*360-\dfrac{15}{100}*360=\dfrac{3}{100}*360=10.8}\)0
Caselet form
In the Caselet form, data is given in the form of reading comprehension or paragraph. To solve the question, data from comprehension is to be converted in the form of a Table or any other easy representation method.
Caselet form DI Example:
Directions: Study the following information carefully and answer the questions given beside.
Shana visited a shopping centre. She purchased some chocolates of three different brands, namely A, B, and C. The number of chocolates of each brand bought by her was equal to the price of the single chocolate of that particular brand. She has spent a sum of Rs. 602. If she had not bought brand C chocolates, then she would have spent only Rs. 313. Suppose, she purchases brand A chocolates at the price of brand B chocolates, brand B chocolates at the price of brand C chocolate, and the brand C chocolates at the price of brand A chocolates but the number of each brand of chocolates purchased by her remains the same then she spends Rs. 21 less than the price of all the chocolates for the actual price.
Q. What is the average number of chocolates purchased by Shana?
Solution: Let the price of single chocolate of A, B, and C brand chocolate is x, y, and z respectively
Then, according to the question, the number of chocolates of brands A, B, and C that were bought by her are x, y, and z respectively
As we know, that number of chocolates of each brand bought by her was equal to the price of single chocolate of that particular brand, and thus, she spent Rs. 602.
Accordingly, we have
The price of all the chocolates = \({ x * x + y * y + z * z = 602 ...........(i)}\)
Further, it is known that if she had not bought brand C chocolates, then she would have spent only Rs. 313.
Accordingly, we have,\({x * x + y * y = 313 .............(ii)}\)
Equation (i) – (ii)
\(z * z = 289\)
\(z = 17\)
Suppose, she purchases brand A chocolates at the price of brand B chocolates, brand B chocolates at the price of brand C chocolates, and the brand C chocolates at the price of brand A chocolates but the number of each brand of chocolates purchased by her remains the same then
\(x * y + y * z + z * x = 602 – 21 = 581\)
We know than, \({(x + y + z)^2 = x^2 + y^2 + z^2 + 2(xy + yz + zx) = 602 + 2 × 581 = 1764}\)
\((x + y + z)^2 = 1764\)
\(x + y + z = 42\)
\({x + y = 42 – 17 = 25 -------- (iii) ---(as \: \: \:z = 17)}\)
\(x^2 + y^2 + 2xy = (x + y)^2\)
\(313 + 2xy = 625\)
\(2xy = 312\)
\({(x – y)^2 = (x + y)^2 – 4xy = 625 – 624 = 1}\)
\(x – y = 1 ----- (iv)\)
By solving (iii) and (iv)
\(x = 13, y = 12\)
Thus, the average number of chocolates purchased by Shana be
\({=\dfrac{x+y+z} {3}=\dfrac{13+12+17}{3}=\dfrac{42}{3}=14}\)
Points to remember while solving Data Interpretation questions:
- Read the instructions carefully as sometimes data is given in percentage form or in terms of thousands, lacs, and crores.
- For question having more than two graphs carefully interlink the data between both the graphs.
- Take notice of all the unit conversions.
- Use approximation in complex calculations carefully.
- Do not extract information from tables or graphs, which is extra and not helpful in solving the given questions.
- Carefully observe the data in case of bar graph and line chart as sometimes the data labels are not mentioned in the graph.
Happy February get 35% Off
Use Coupon code FEB26


Share Blog
 Latest

Latest Current Affairs

Daily Current Affairs and GK | 12 and 13 April 2026
Read More
Daily Current Affairs and GK | 11 April 2026
Read More
Daily Current Affairs and GK | 10 April 2026
Read More
Daily Current Affairs and GK | 9 April 2026
Read More
Daily Current Affairs and GK | 8 April 2026
Read More

Comments